Compare Two Lists
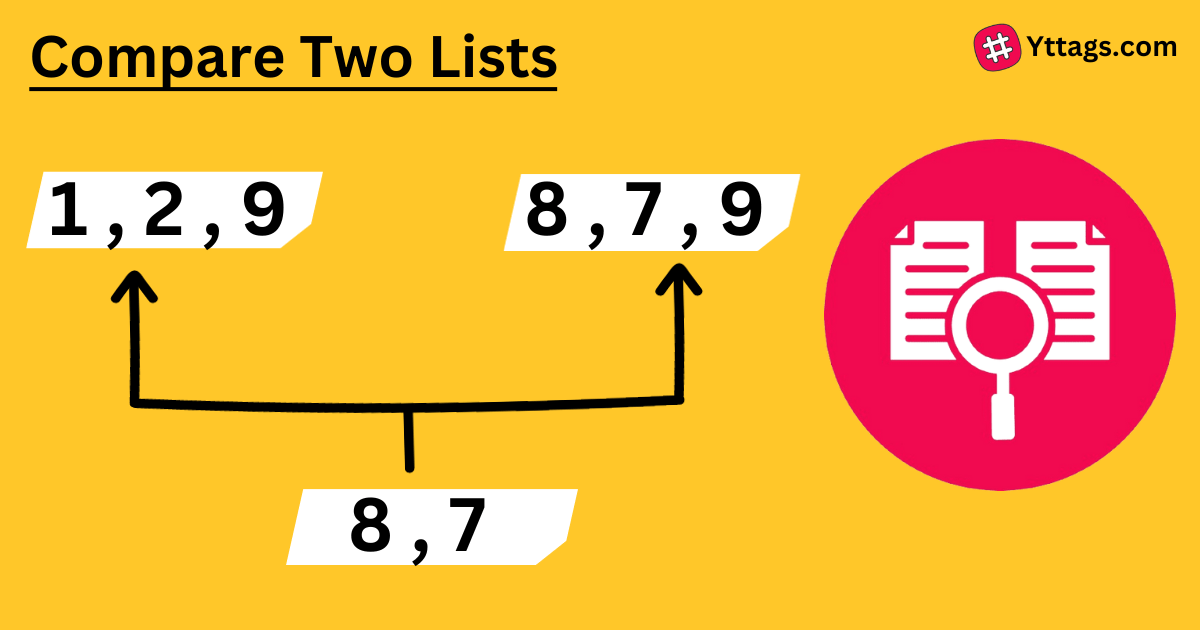
Want to compare two lists of names, e-mails, domains, genes, followers or something else? This tool shows you the unique and shared values in your two lists.
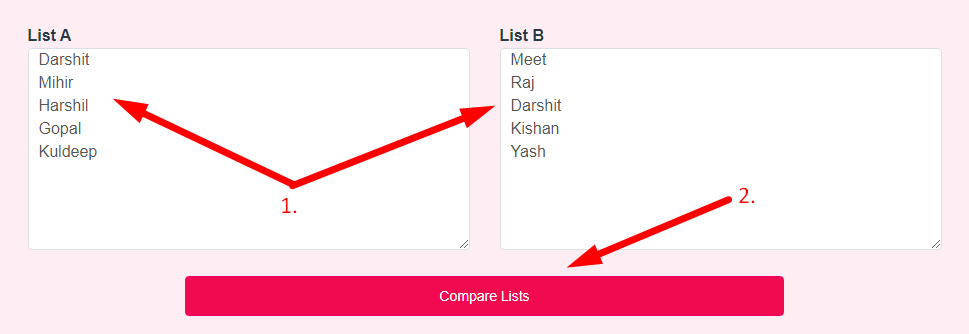
List A
List B
List B lines not found in List A: List B contains 0 new line(s).
If you use this great tool then please comment and/or like this page.
Average Rating: Tool Views: 391
Average Rating: Tool Views: 391
Subscribe for Latest Tools
How to use this Compare Two Lists Tool?
How to use Yttags's Compare Two Lists?
- Step 1: Select the Tool

- Step 2: Enter List A And List B And Click On Compare List Button

- Step 3: Check Your Compare Two Lists Result

This tool lets you easily compare and find the differences between two lists of items.
If you want to link to Compare Two Lists page, please use the codes provided below!

FAQs for Compare Two Lists
What is a Compare Two Lists?
A "Compare Two Lists" function or tool identifies and highlights the differences or similarities between two lists, assisting in data analysis and identifying common or unique elements between the two sets.
How do I compare two lists together?
To do this, select both lists and click on the Conditional Formatting button in the Home tab of the Excel ribbon. From there, choose "Highlight Cell Rules" and then "Duplicate Values." This will highlight any cells that appear in both lists, so you can easily spot the entries that are common to both.
How do you compare two lists equal?
The list. sort() method sorts the two lists and the == operator compares the two lists item by item which means they have equal data items at equal positions. This checks if the list contains equal data item values but it does not take into account the order of elements in the list.
What is the tool to compare two columns?
If you're looking to compare two columns of data to find matches or discrepancies, the VLOOKUP function can be a very helpful tool.
What is the best way to compare data?
A Dual Axis Line Chart is one of the best graph to compare two sets of data. The chart has a secondary y-axis to help you display insights into two varying data points. More so, it uses two axes to easily illustrate the relationships between two variables with different magnitudes and scales of measurement.